A simple tagging engine for research ops teams and technical researchers.
MAP DATA
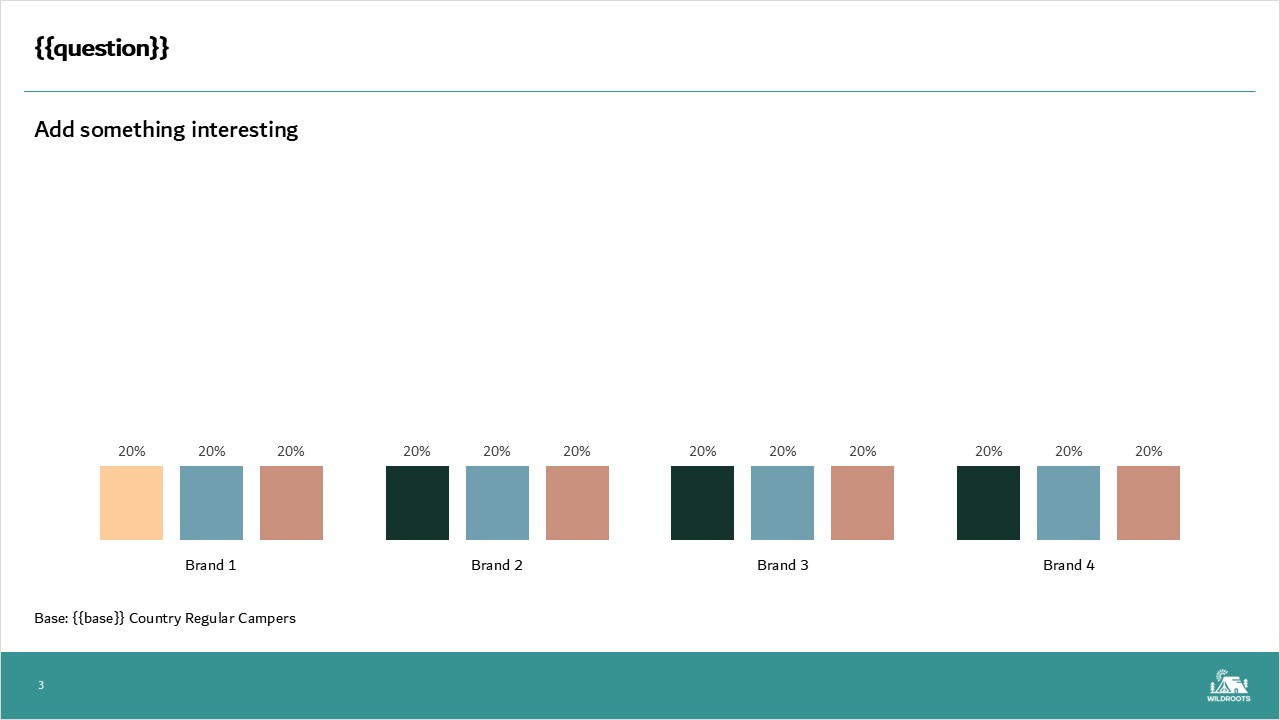
Pull the right data into every slide
Tag any chart or table in your template, then write a short query to choose the data it shows. Here, we select the results and sort them by the first column. Next wave, swap the data file and the slide refreshes.
CONDITIONAL FORMATTING
Highlight what matters, cell by cell
Map your data to a table, then set rules for how each cell should look. Combine multiple conditions in one query, so key results stand out on every update without manual formatting.
SIGNIFICANCE TESTING
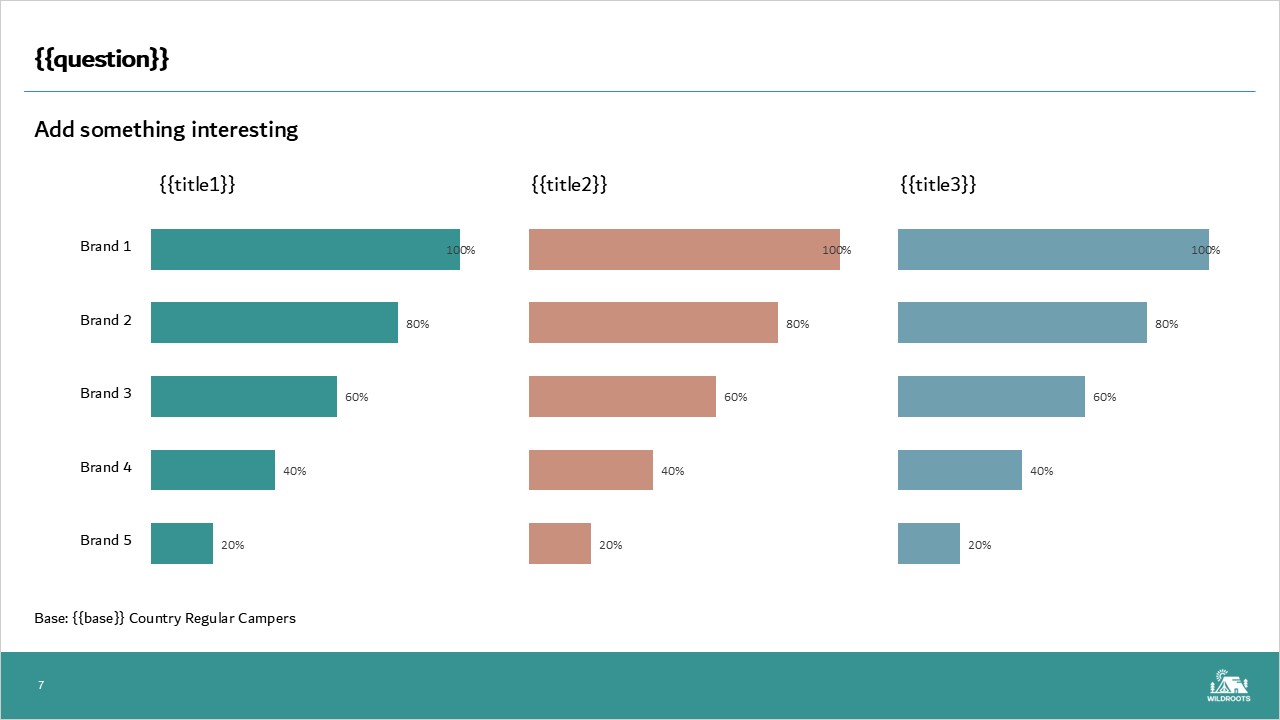
Sig test every brand in one step
Map your data to three charts, then set a control group to test against. Here, every brand is tested against Wild Roots at 95% confidence, and significant differences are flagged automatically across all three charts.
By clicking “Accept”, you agree to the storing of cookies on your device to enhance site navigation, analyze site usage, and assist in our marketing efforts. View our Privacy Policy for more information.
One-click tools for the formatting jobs that eat up time at the end of a project, such as sig testing, colour palettes, logos on charts and label clean-up.
Book a 30-minute demo and we'll show you how SlideMap could handle your trackers and recurring reports. Demo attendees can also get early access to try the add-in with their team.